KI-Beratung Beta

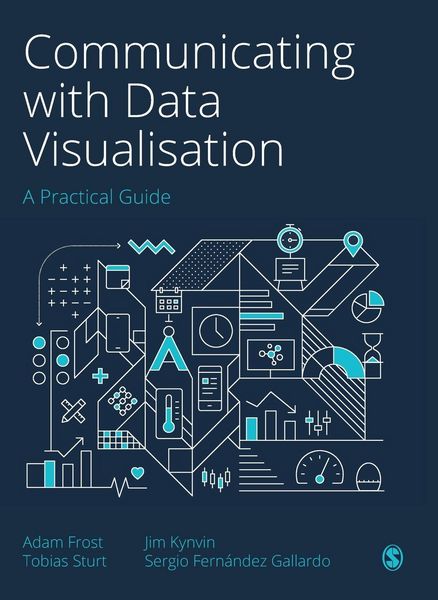
Produktbild: Communicating with Data Visualisation
- 12%

Communicating with Data Visualisation A Practical Guide

12% sparen

146,99 € UVP 167,20 €

inkl. gesetzl. MwSt., Versandkostenfrei


Beschreibung

How can you transform a spreadsheet of numbers into a clear, compelling story that your audience will want to pass on? This book is a step-by-step guide (honed through the authors' Guardian masterclasses, workshops and seminars) to bringing data to life through visualisations, from static charts and...

Beschreibung

How can you transform a spreadsheet of numbers into a clear, compelling story that your audience will want to pass on?
This book is a step-by-step guide (honed through the authors' Guardian masterclasses, workshops and seminars) to bringing data to life through visualisations, from static charts and maps to interactive infographics and motion graphics.
Introducing a four-step framework to creating engaging and innovative visualisations, it helps you to:
·       Find the human stories in your datasets
·       Design a visual story that will resonate with your audience
·       Make a clear, persuasive visual that represents your data truthfully
·       Refine your work to ensure your visual expresses your story in the best possible way.
This book also includes a portfolio of best-practice examples and annotated templates to help you choose the right visual for the right audience, and repurpose your work for different contexts.

Rezension

This is an enjoyable and informative read from four premier data visualisation experts. Grounded in their award-winning practice and teaching, the authors offer concrete strategies and a wealth of examples for anyone wishing to create intuitive and engaging data visualisations.  Penny Sheets Thibaut 20211012

Produktdetails

Einband

Gebundene Ausgabe

Erscheinungsdatum

06.12.2021

Verlag Sage Publications
Seitenzahl

368

Produktdetails

Einband

Gebundene Ausgabe

Erscheinungsdatum

06.12.2021

Verlag Sage Publications
Seitenzahl

368

Maße (L/B/H)

25,2/19,4/2,4 cm

Gewicht

912 g

Sprache

Englisch

ISBN

978-1-5297-4376-0

EU-Ansprechpartner

Kolibri 360 GmbH
Ettore-Bugatti-Straße 6-14
51149 Köln
DE
produktsicherheit@kolibri360.de

Herstelleradresse

SAGE Publications
1 Oliver's Yard 55 City Road
EC1Y 1SP London
GB
orders@sagepub.co.uk

Noch keine Bewertungen vorhanden

Verfassen Sie die erste Bewertung zu diesem Artikel

Helfen Sie anderen Kundinnen und Kunden durch Ihre Meinung.

Kundinnen und Kunden meinen

Bewertungen (0)

Die Leseprobe wird geladen.
  • Produktbild: Communicating with Data Visualisation
  • Introduction: Notes from the Underground
    Part 1: The Data Visualisation Process
    Chapter 1: Find, design, make, refine
    Chapter 2: A spectrum of right answers
    Chapter 3: Find
    Chapter 4: Designing Static Graphics
    Chapter 5: Making Static Graphics
    Chapter 6: An Introduction to Interactive Data Visualisation
    Chapter 7: Designing Motion Graphics
    Chapter 8: Making Motion Graphics
    Chapter 9: Designing Interactive Infographics
    Chapter 10: Making Interactive Infographics
    Chapter 11: Refine
    Chapter 12: Resources
    Part 2: Finding the Right Chart For Your Story