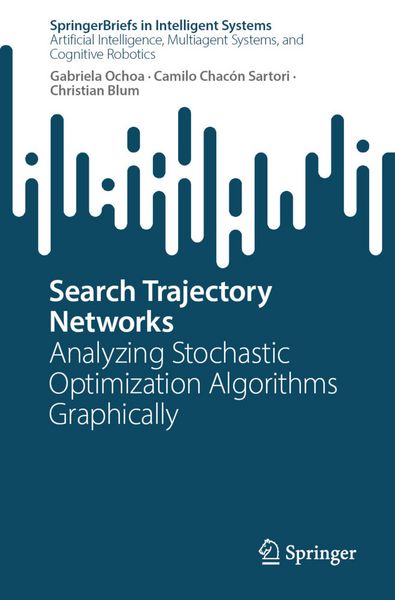
Search Trajectory Networks Analyzing Stochastic Optimization Algorithms Graphically
-
- Englisch ausgewählt
54,99 €
inkl. gesetzl. MwSt.,
Beschreibung
Produktdetails
Einband
Taschenbuch
Erscheinungsdatum
16.01.2027
Abbildungen
Approx. 125 p.
Verlag
SpringerMaße (B/H)
15,5/23,5 cm
Sprache
Englisch
ISBN
978-3-032-42868-4
Visual representations of complex concepts enhance our ability to understand digital information more effectively, particularly in fields like Computer Science and Artificial Intelligence. Despite this, the research community in optimization has been relatively unproductive in developing visual tools, even though there is a growing need for such tools to aid in comparing optimization algorithms. Traditionally, the comparison of optimization algorithms has relied on collecting numerical data from optimization runs and presenting them through tables and conventional data visualizations (e.g., line plots, bar plots, scatter plots). This has typically been supplemented by statistical analyses of the data. However, in recent years, more researchers have recognized that to gain a deeper understanding of the behavior of optimization algorithms, such as metaheuristics, additional graphical tools are necessary. Furthermore, these tools must be user-friendly to facilitate their use.
In this book, the authors present one of the latest and most advanced efforts in this direction. Search Trajectory Networks (STNs) provide a means of representing multiple runs of multiple optimization algorithms applied to the same instance of an optimization problem. Mathematically, STNs are directed graphs. The authors first provide a formal description of how STNs can be constructed from data logs generated by runs of optimization algorithms. The resulting STNs can then be visualized using graph-layout techniques, enabling users to visually inspect and analyze the search behavior of the algorithms. Such visualizations can potentially be generated in different ways. The authors introduce STNWeb, currently the principal tool for this purpose. They provide a detailed account of its functionality and explain how the resulting visualizations can be analyzed and interpreted. Notably, STNWeb incorporates Large Language Model (LLM) support to assist users in analyzing these visualizations. Finally, the authors present a range of compelling use cases illustrating how STN visualizations can contribute to algorithmic research on metaheuristics.
Noch keine Bewertungen vorhanden
Verfassen Sie die erste Bewertung zu diesem Artikel
Helfen Sie anderen Kundinnen und Kunden durch Ihre Meinung.
Kurze Frage zu unserer Seite
Vielen Dank für Ihr Feedback
Wir nutzen Ihr Feedback, um unsere Produktseiten zu verbessern. Bitte haben Sie Verständnis, dass wir Ihnen keine Rückmeldung geben können. Falls Sie Kontakt mit uns aufnehmen möchten, können Sie sich aber gerne an unseren Kund*innenservice wenden.
zum Kundenservice