KI-Beratung Beta

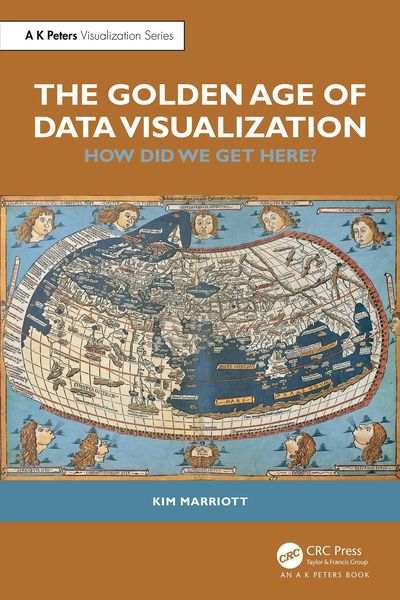
Produktbild: The Golden Age of Data Visualization

The Golden Age of Data Visualization How Did We Get Here?

75,60 €

inkl. gesetzl. MwSt.

Beschreibung

We are living in the Golden Age of Data Visualization. The COVID-19 pandemic has demonstrated how we increasingly use data visualizations to make sense of the world. Business analysts fill their presentations with charts, journalists use infographics to engage their readers, we rely on the dials and...

Beschreibung

We are living in the Golden Age of Data Visualization. The COVID-19 pandemic has demonstrated how we increasingly use data visualizations to make sense of the world. Business analysts fill their presentations with charts, journalists use infographics to engage their readers, we rely on the dials and gauges on our household appliances, and we use mapping apps on our smartphones to find our way.

This book explains how and why this has happened. It details the evolution of information graphics, the kinds of graphics at the core of data visualization-maps, diagrams, charts, scientific and medical images-from prehistory to the present day. It explains how the cultural context, production and presentation technologies, and data availability have shaped the history of data visualization. It considers the perceptual and cognitive reasons why data visualization is so effective and explores the little-known world of tactile graphics-raised-line drawings used by people who are blind. The book also investigates the way visualization has shaped our modern world. The European Renaissance and the Scientific Revolution relied on maps and technical and scientific drawings, and graphics influence how we think about abstract concepts like time and social connection.

This book is written for data visualization researchers and professionals and anyone interested in data visualization and the way we use graphics to understand and think about the world.

Produktdetails

Format

PDF

Kopierschutz

Ja

Family Sharing

Nein

Text-to-Speech

Nein

Produktdetails

Format

PDF

Format

eBooks im PDF-Format haben eine festgelegte Seitengröße und eignen sich daher nur bedingt zum Lesen auf einem tolino eReader oder Smartphone. Für den vollen Lesegenuss empfehlen wir Ihnen bei PDF-eBooks die Verwendung eines Tablets oder Computers.

Kopierschutz

Ja

Kopierschutz

Zum Lesen dieses eBooks auf Geräten der tolino Familie sowie auf sonstigen eReadern und am PC benötigen Sie eine Adobe ID. Weitere Hinweise zum Lesen von kopiergeschützten eBooks finden Sie unter Hilfe/Downloads.

Family Sharing

Nein

Family Sharing

Mit Family Sharing können Sie eBooks innerhalb Ihrer Familie (max. sechs Mitglieder im gleichen Haushalt) teilen. Sie entscheiden selbst, welches Buch Sie mit welchem Familienmitglied teilen möchten. Auch das parallele Lesen durch verschiedene Familienmitglieder ist durch Family Sharing möglich. Um eBooks zu teilen oder geteilt zu bekommen, muss jedes Familienmitglied ein Konto bei Thalia oder einem anderen tolino-Buchhändler haben. Weitere Informationen finden Sie unter Hilfe/Family-Sharing.

Text-to-Speech

Nein

Text-to-Speech

Bedeutet Ihnen Stimme mehr als Text? Mit der Funktion Text-to-Speech können Sie sich im tolino webReader und in der aktuellen Thalia – Lesen & Hören App das eBook vorlesen lassen. Weitere Informationen finden Sie unter Hilfe/Text-to-Speech.

Erscheinungsdatum

04.09.2024

Verlag Taylor & Francis eBooks
Seitenzahl

374 (Printausgabe)

Auflage

1. Auflage

Sprache

Englisch

EAN

9781040111413

Barrierefreiheit
  • navigierbares Inhaltsverzeichnis
  • kurze Alternativtexte (z.B. für Abbildungen) vorhanden
  • keine Vorlesefunktionen des Lesesystems deaktiviert
  • navigierbarer Index
  • Seitennummerierung folgt dem gedruckten Werk

Noch keine Bewertungen vorhanden

Verfassen Sie die erste Bewertung zu diesem Artikel

Helfen Sie anderen Kundinnen und Kunden durch Ihre Meinung.

Kundinnen und Kunden meinen

Bewertungen (0)

Weitere Artikel finden Sie in

  • Produktbild: The Golden Age of Data Visualization