Statistical Process Control and Data Analytics
-
- Hardcover
- Taschenbuch ausgewählt
- eBook
-
Sprache:Englisch
73,99 €
inkl. gesetzl. MwSt.,
Beschreibung
Produktdetails
Einband
Taschenbuch
Erscheinungsdatum
02.09.2024
Abbildungen
schwarz-weiss Illustrationen, Zeichnungen, schwarz-weiss, Tabellen, schwarz-weiss
Verlag
Taylor & FrancisSeitenzahl
386
Maße (L/B/H)
24,6/17,4/2,1 cm
Gewicht
680 g
Auflage
8. Auflage
Sprache
Englisch
ISBN
978-1-03-256902-4
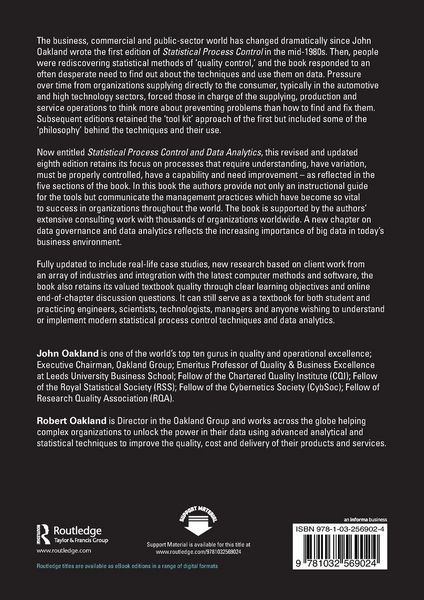
The business, commercial and public-sector world has changed dramatically since John Oakland wrote the first edition of Statistical Process Control in the mid-1980s. Then, people were rediscovering statistical methods of 'quality control,' and the book responded to an often desperate need to find out about the techniques and use them on data. Pressure over time from organizations supplying directly to the consumer, typically in the automotive and high technology sectors, forced those in charge of the supplying, production and service operations to think more about preventing problems than how to find and fix them. Subsequent editions retained the 'tool kit' approach of the first but included some of the 'philosophy' behind the techniques and their use.
Now entitled Statistical Process Control and Data Analytics, this revised and updated eighth edition retains its focus on processes that require understanding, have variation, must be properly controlled, have a capability and need improvement - as reflected in the five sections of the book. In this book the authors provide not only an instructional guide for the tools but communicate the management practices which have become so vital to success in organizations throughout the world. The book is supported by the authors' extensive consulting work with thousands of organizations worldwide. A new chapter on data governance and data analytics reflects the increasing importance of big data in today's business environment.
Fully updated to include real-life case studies, new research based on client work from an array of industries and integration with the latest computer methods and software, the book also retains its valued textbook quality through clear learning objectives and online end-of-chapter discussion questions. It can still serve as a textbook for both student and practicing engineers, scientists, technologists, managers and anyone wishing to understand or implement modern statistical process control techniques and data analytics.
Kundinnen und Kunden meinen
Verfassen Sie die erste Bewertung zu diesem Artikel
Helfen Sie anderen Kund*innen durch Ihre Meinung
Kurze Frage zu unserer Seite
Vielen Dank für Ihr Feedback
Wir nutzen Ihr Feedback, um unsere Produktseiten zu verbessern. Bitte haben Sie Verständnis, dass wir Ihnen keine Rückmeldung geben können. Falls Sie Kontakt mit uns aufnehmen möchten, können Sie sich aber gerne an unseren Kund*innenservice wenden.
zum Kundenservice