Data Visualization Charts, Maps, and Interactive Graphics
-
- Taschenbuch
- eBook ausgewählt
-
Form:Einzelkauf Download
-
Sprache:Englisch
-
eBook Format:PDF
- PDF 35,00 € ausgewählt
- ePUB 35,00 €
35,00 €
inkl. gesetzl. MwSt.Beschreibung
Produktdetails
Format
Kopierschutz
Ja
Family Sharing
Nein
Text-to-Speech
Nein
Erscheinungsdatum
07.12.2018
Verlag
Taylor & Francis eBooksSeitenzahl
248 (Printausgabe)
Dateigröße
64849 KB
Auflage
1. Auflage
Sprache
Englisch
EAN
9781351781756
This is the age of data. There are more innovations and more opportunities for interesting work with data than ever before, but there is also an overwhelming amount of quantitative information being published every day. Data visualisation has become big business, because communication is the difference between success and failure, no matter how clever the analysis may have been. The ability to visualize data is now a skill in demand across business, government, NGOs and academia.
Data Visualization: Charts, Maps, and Interactive Graphics gives an overview of a wide range of techniques and challenges, while staying accessible to anyone interested in working with and understanding data.
Features:
- Focusses on concepts and ways of thinking about data rather than algebra or computer code.
- Features 17 short chapters that can be read in one sitting.
- Includes chapters on big data, statistical and machine learning models, visual perception, high-dimensional data, and maps and geographic data.
- Contains more than 125 visualizations, most created by the author.
- Supported by a website with all code for creating the visualizations, further reading, datasets and practical advice on crafting the images.
Whether you are a student considering a career in data science, an analyst who wants to learn more about visualization, or the manager of a team working with data, this book will introduce you to a broad range of data visualization methods.
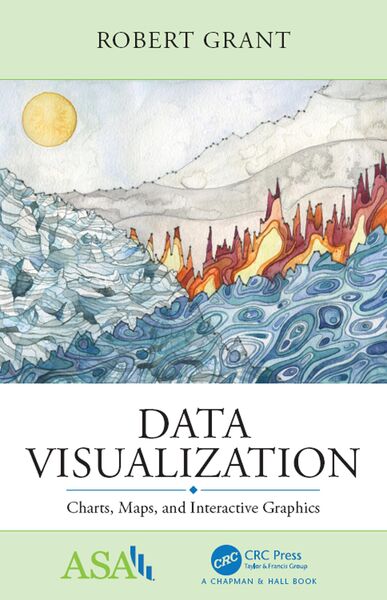
Cover image: Landscape of Change uses data about sea level rise, glacier volume decline, increasing global temperatures, and the increasing use of fossil fuels. These data lines compose a landscape shaped by the changing climate, a world in which we are now living. Copyright © Jill Pelto (jillpelto.com).
Noch keine Bewertungen vorhanden
Verfassen Sie die erste Bewertung zu diesem Artikel
Helfen Sie anderen Kundinnen und Kunden durch Ihre Meinung.
Kurze Frage zu unserer Seite
Vielen Dank für Ihr Feedback
Wir nutzen Ihr Feedback, um unsere Produktseiten zu verbessern. Bitte haben Sie Verständnis, dass wir Ihnen keine Rückmeldung geben können. Falls Sie Kontakt mit uns aufnehmen möchten, können Sie sich aber gerne an unseren Kund*innenservice wenden.
zum Kundenservice