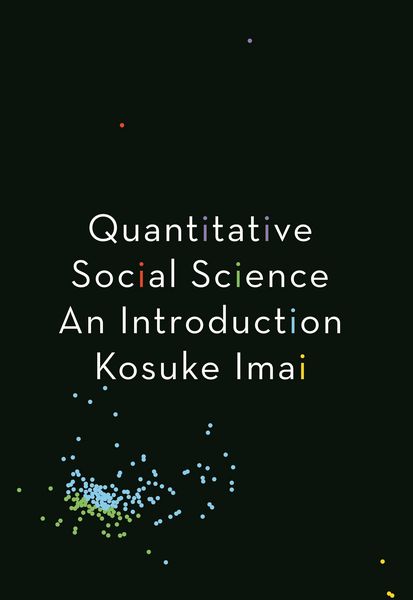
Quantitative Social Science An Introduction
-
- Hardcover ausgewählt
- Taschenbuch
- eBook
-
Sprache:Englisch
-
Verlag:Princeton University Press
151,99 €
inkl. gesetzl. MwSt.,
Beschreibung
Produktdetails
Einband
Gebundene Ausgabe
Erscheinungsdatum
09.02.2018
Verlag
Princeton University PressSeitenzahl
432
Maße (L/B/H)
25,7/18/3 cm
Gewicht
1066 g
Sprache
Englisch
ISBN
978-0-691-16703-9
"Kosuke Imai has produced a superb hands-on introduction to modern quantitative methods in the social sciences. Placing practical data analysis front and center, this book is bound to become a standard reference in the field of quantitative social science and an indispensable resource for students and practitioners alike."--Alberto Abadie, Massachusetts Institute of Technology
"The search for a good undergraduate social science textbook is eternal, but with Imai's book, the search may well be over. It covers a host of cutting-edge issues in quantitative analysis, from causality and inference to its use of R so that students can advance in both their research and work lives. Imai plots a new way for us to think about how to teach undergraduate methods."--Nathaniel Beck, New York University
"Kosuke Imai's book takes a very novel and interesting approach to a first quantitative methods course for the social sciences. Focusing on interesting questions from the beginning, he starts by introducing the potential outcome approach to causality, and proceeds to present the reader with a wide range of methods for an admirably broad range of settings, including textual, network, and spatial data. Integrated with the methodological discussions are examples with detailed R code. Readers who work through this book will be well equipped to use modern methods for data analysis in the social sciences. I highly recommend this book!"--Guido W. Imbens, coauthor of Causal Inference for Statistics, Social, and Biomedical Sciences
"This important new book seeks to democratize quantitative social science. In it, one of the world's foremost political methodologists shows how you can join the movement that has changed so much of the academic, commercial, government, and nonprofit worlds. It provides a seamless path from ignorance to insight in a few hundred clear and enlightening pages."--Gary King, Harvard University
"Imai's new textbook has the potential to totally transform how undergraduate statistics is taught. The focus is on data analysis first and statistics second. It is full of great and relevant empirical examples. Students will engage this book rather than dread it."--Christopher Winship, Harvard University
"This is the ideal book for a first class on data analysis. Not only does it provide students with a clear, accessible, and technically correct introduction to research design, computing with data, and statistical inference, but it does what truly great introductions to a topic all do--it generates excitement."--Kevin M. Quinn, University of California, Berkeley
"Finally, a statistics text has caught up with rapid developments in the social sciences in the last two decades, spanning everything from the rediscovery of design, randomization, and causality to Bayesian approaches. From the organization of the subject matter (e.g., causality, measurement, uncertainty) to the mode of presentation, Imai has produced a work that is both comprehensive and accessible, but reflects the vast breadth of topics and approaches today's social scientists are expected to know. The examples are extremely well chosen, a delight to read, and accompanied by R code. Social science finally has an introductory book that presents statistics as it is practiced at the research frontier today, not thirty years ago."--Simon Jackman, United States Studies Centre, University of Sydney
"Imai's new book on quantitative social science represents a groundbreaking and effective method for teaching statistics and quantitative methods to students in any number of fields--ranging from public health and medicine to education and political science. The motivating examples, clear and engaging exposition, and easy implementation for students will make it a resource they (and their instructors) turn to again and again."--Elizabeth Stuart, Johns Hopkins Bloomberg School of Public Health
"Imai's fantastic textbook provides a succinct but thorough introduction to quantitative methods and how they are applied to social science problems. The text is easy to read while also providing material that is generally pitched at a level appropriate for newcomers to the subject."--Justin Grimmer, Stanford University
"Imai's text is engaging and full of examples. It will be widely taught and will have a wide impact. Anyone who really masters the skills and concepts presented here will know statistics better than many professional political scientists."--Andrew Eggers, University of Oxford
Noch keine Bewertungen vorhanden
Verfassen Sie die erste Bewertung zu diesem Artikel
Helfen Sie anderen Kundinnen und Kunden durch Ihre Meinung.
Kurze Frage zu unserer Seite
Vielen Dank für Ihr Feedback
Wir nutzen Ihr Feedback, um unsere Produktseiten zu verbessern. Bitte haben Sie Verständnis, dass wir Ihnen keine Rückmeldung geben können. Falls Sie Kontakt mit uns aufnehmen möchten, können Sie sich aber gerne an unseren Kund*innenservice wenden.
zum Kundenservice