
KI-Beratung Beta

Gutscheinbedingungen

**Gültig am 20.11.2026 ab einem Mindestbestellwert von 30€ auf Spielzeug, Schreibwaren, Filme, Geschenke & Trends, Musik, tolino eReader & Zubehör, Hörbücher und Hörbuch-Downloads, nicht preisgebundene Bücher und Kalender online auf thalia.at und in der Thalia App. Einzelne Artikel können ausgeschlossen sein. Aufgrund der Buchpreisbindung sind deutschsprachige Bücher und eBooks ausgenommen. Zusätzlich ausgenommen sind Abos & Flatrates, Games, Geschenkkarten/-boxen, Shelfies, Software, Zeitschriften sowie einzelne Artikel von tonies®. Pro Einkauf einmal einlösbar. Click & Collect nur bei Onlinevorabzahlung möglich. Keine Barauszahlung. Nicht kombinierbar mit anderen Aktionen und Gutscheinen. Gutschein wird auf max. 500€ Bestellwert angerechnet. Nicht gültig für Versandkosten und Services. Preisgebundene Artikel sind vom Mindestbestellwert ausgeschlossen.

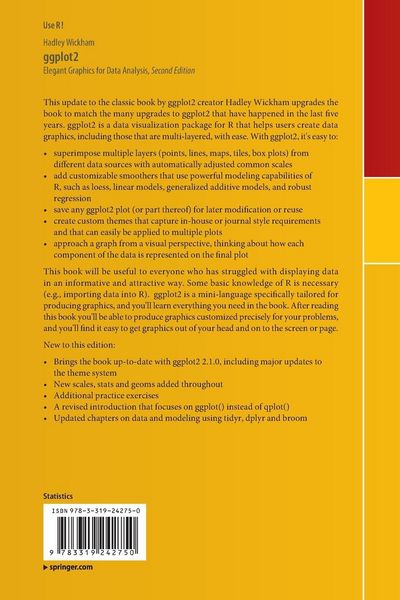
  • Produktbild: ggplot2
  • Produktbild: ggplot2
- 11%

ggplot2 Elegant Graphics for Data Analysis

Aus der Reihe Use R!
11% sparen

62,99 € UVP 71,49 €

inkl. gesetzl. MwSt., Versandkostenfrei


Beschreibung

This new edition to the classic book by ggplot2 creator Hadley Wickham highlights compatibility with knitr and RStudio. ggplot2 is a data visualization package for R that helps users create data graphics, including those that are multi-layered, with ease. With ggplot2, it's easy to: 

  • produce handsome,...

Beschreibung

This new edition to the classic book by ggplot2 creator Hadley Wickham highlights compatibility with knitr and RStudio. ggplot2 is a data visualization package for R that helps users create data graphics, including those that are multi-layered, with ease. With ggplot2, it's easy to: 

  • produce handsome, publication-quality plots with automatic legends created from the plot specification
  • superimpose multiple layers (points, lines, maps, tiles, box plots) from different data sources with automatically adjusted common scales
  • add customizable smoothers that use powerful modeling capabilities of R, such as loess, linear models, generalized additive models, and robust regression
  • save any ggplot2 plot (or part thereof) for later modification or reuse
  • create custom themes that capture in-house or journal style requirements and that can easily be applied to multiple plots
  • approach a graph from a visual perspective, thinking about how eachcomponent of the data is represented on the final plot

This book will be useful to everyone who has struggled with displaying data in an informative and attractive way. Some basic knowledge of R is necessary (e.g., importing data into R).  ggplot2 is a mini-language specifically tailored for producing graphics, and you'll learn everything you need in the book. After reading this book you'll be able to produce graphics customized precisely for your problems, and you'll find it easy to get graphics out of your head and on to the screen or page.

Rezension

“The versatility and efficiency of ggplot have led to the development of ggplot2 and this book which overviews the standard use and presentation secrets of functions developed in the last 5 years. … The book is written in an accessible manner and it is suitable for undergraduates, postgraduates and researchers with some R experience. All theoretical concepts are accompanied by code making it easy to learn by reproducing the examples.” (Irina Ioana Mohorianu, zbMATH 1397.62006, 2018)
“The book is an excellent and very comprehensive manual of … one of the most popular R packages. It is currently the only book describing ggplot2 in such depth. The book contains many examples and is very nicelyillustrated, demonstrating the strength of the package.” (Klaus Galensa, Computing Reviews, May, 2017)

Produktdetails

Einband

Taschenbuch

Erscheinungsdatum

16.06.2016

Abbildungen

XVI, 260 p. 232 illus., 140 illus. in color.

Verlag Springer

Produktdetails

Einband

Taschenbuch

Erscheinungsdatum

16.06.2016

Abbildungen

XVI, 260 p. 232 illus., 140 illus. in color.

Verlag Springer
Seitenzahl

260

Maße (L/B/H)

23,5/15,5/1,6 cm

Gewicht

423 g

Auflage

Second Edition 2016

Sprache

Englisch

ISBN

978-3-319-24275-0

Herstelleradresse

Springer-Verlag KG
Sachsenplatz 4-6
1201 Wien
AT

Email: ProductSafety@springernature.com

Noch keine Bewertungen vorhanden

Verfassen Sie die erste Bewertung zu diesem Artikel

Helfen Sie anderen Kundinnen und Kunden durch Ihre Meinung.

Kundinnen und Kunden meinen

Bewertungen (0)

  • Produktbild: ggplot2
  • Produktbild: ggplot2
  • Introduction.- Getting Started with ggplot2.- Toolbox.- Mastering the Grammar.- Building a Plot Layer by Layer.- Scales, Axes and Legends.- Positioning.- Themes.- Data Analysis.- Data Transformation.- Modelling for Visualisation.- Programming with ggplot2.- Index.- R Code Index.