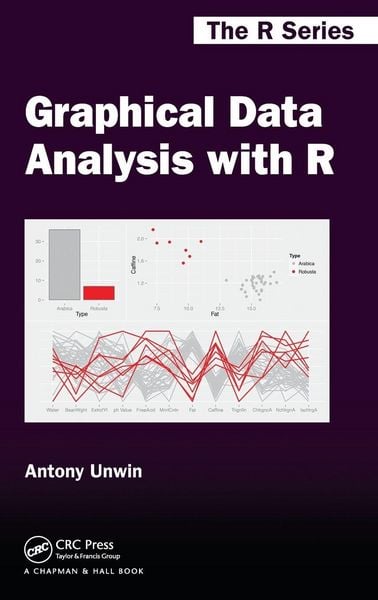
Graphical Data Analysis with R
-
- Hardcover ausgewählt
- Taschenbuch
- eBook
-
Sprache:Englisch
153,99 €
inkl. gesetzl. MwSt.,
Beschreibung
Produktdetails
Einband
Gebundene Ausgabe
Erscheinungsdatum
20.05.2015
Abbildungen
farbige Illustrationen, Tabellen, schwarz-weiss
Verlag
Taylor and FrancisSeitenzahl
312
Maße (L/B/H)
24/16,1/2,1 cm
Gewicht
634 g
Sprache
Englisch
ISBN
978-1-4987-1523-2
See How Graphics Reveal Information Graphical Data Analysis with R shows you what information you can gain from graphical displays. The book focuses on why you draw graphics to display data and which graphics to draw (and uses R to do so). Graphical data analysis is useful for data cleaning, exploring data structure, detecting outliers and unusual groups, identifying trends and clusters, spotting local patterns, evaluating modelling output, and presenting results. This book guides you in choosing graphics and understanding what information you can glean from them. It can be used as a primary text in a graphical data analysis course or as a supplement in a statistics course. Colour graphics are used throughout.
Noch keine Bewertungen vorhanden
Verfassen Sie die erste Bewertung zu diesem Artikel
Helfen Sie anderen Kundinnen und Kunden durch Ihre Meinung.
Kurze Frage zu unserer Seite
Vielen Dank für Ihr Feedback
Wir nutzen Ihr Feedback, um unsere Produktseiten zu verbessern. Bitte haben Sie Verständnis, dass wir Ihnen keine Rückmeldung geben können. Falls Sie Kontakt mit uns aufnehmen möchten, können Sie sich aber gerne an unseren Kund*innenservice wenden.
zum Kundenservice