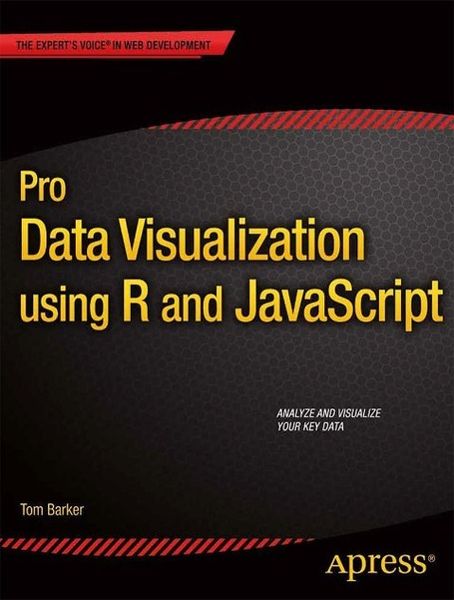
Pro Data Visualization using R and JavaScript
-
- Taschenbuch
- eBook ausgewählt
-
Form:Einzelkauf Download
-
Sprache:Englisch
-
eBook Format:ePUB
- PDF 64,76 €
- ePUB 54,47 € ausgewählt
54,47 €
inkl. gesetzl. MwSt.Beschreibung
Produktdetails
Format
ePUB
Kopierschutz
Nein
Family Sharing
Nein
Text-to-Speech
Ja
Erscheinungsdatum
04.08.2013
Verlag
SpringerSeitenzahl
216 (Printausgabe)
Dateigröße
34847 KB
Auflage
1st ed
Sprache
Englisch
EAN
9781430258070
With the popularity of the R language, the art and practice of creating data visualizations is no longer the preserve of mathematicians, statisticians, or cartographers. As technology leaders, we can gather metrics around what we do and use data visualizations to communicate that information. Pro Data Visualization using R and JavaScript combines the power of the R language with the simplicity and familiarity of JavaScript to display clear and informative data visualizations.
Gathering and analyzing empirical data is the key to truly understanding anything. We can track operational metrics to quantify the health of our products in production. We can track quality metrics of our projects, and even use our data to identify bad code. Visualizing this data allows anyone to read our analysis and easily get a deep understanding of the story the data tells.
Noch keine Bewertungen vorhanden
Verfassen Sie die erste Bewertung zu diesem Artikel
Helfen Sie anderen Kundinnen und Kunden durch Ihre Meinung.
Kurze Frage zu unserer Seite
Vielen Dank für Ihr Feedback
Wir nutzen Ihr Feedback, um unsere Produktseiten zu verbessern. Bitte haben Sie Verständnis, dass wir Ihnen keine Rückmeldung geben können. Falls Sie Kontakt mit uns aufnehmen möchten, können Sie sich aber gerne an unseren Kund*innenservice wenden.
zum Kundenservice