Beschreibung
Produktdetails
Einband
Gebundene Ausgabe
Erscheinungsdatum
15.04.2016
Herausgeber
Ionut Florescu + weitereVerlag
John Wiley & SonsSeitenzahl
456
Maße (L/B/H)
24/16,1/2,9 cm
Gewicht
844 g
Auflage
1. Auflage
Sprache
Englisch
ISBN
978-1-118-44398-9
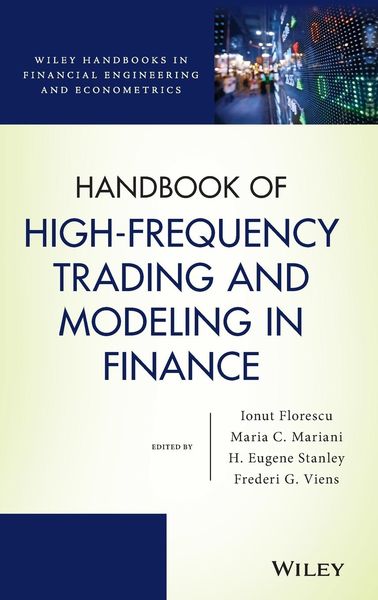
Reflecting the fast pace and ever-evolving nature of the financial industry, the Handbook of High-Frequency Trading and Modeling in Finance details how high-frequency analysis presents new systematic approaches to implementing quantitative activities with high-frequency financial data.
Introducing new and established mathematical foundations necessary to analyze realistic market models and scenarios, the handbook begins with a presentation of the dynamics and complexity of futures and derivatives markets as well as a portfolio optimization problem using quantum computers. Subsequently, the handbook addresses estimating complex model parameters using high-frequency data. Finally, the handbook focuses on the links between models used in financial markets and models used in other research areas such as geophysics, fossil records, and earthquake studies. The Handbook of High-Frequency Trading and Modeling in Finance also features:
* Contributions by well-known experts within the academic, industrial, and regulatory fields
* A well-structured outline on the various data analysis methodologies used to identify new trading opportunities
* Newly emerging quantitative tools that address growing concerns relating to high-frequency data such as stochastic volatility and volatility tracking; stochastic jump processes for limit-order books and broader market indicators; and options markets
* Practical applications using real-world data to help readers better understand the presented material
The Handbook of High-Frequency Trading and Modeling in Finance is an excellent reference for professionals in the fields of business, applied statistics, econometrics, and financial engineering. The handbook is also a good supplement for graduate and MBA-level courses on quantitative finance, volatility, and financial econometrics.
Ionut Florescu, PhD, is Research Associate Professor in Financial Engineering and Director of the Hanlon Financial Systems Laboratory at Stevens Institute of Technology. His research interests include stochastic volatility, stochastic partial differential equations, Monte Carlo Methods, and numerical methods for stochastic processes. Dr. Florescu is the author of Probability and Stochastic Processes, the coauthor of Handbook of Probability, and the coeditor of Handbook of Modeling High-Frequency Data in Finance, all published by Wiley.
Maria C. Mariani, PhD, is Shigeko K. Chan Distinguished Professor in Mathematical Sciences and Chair of the Department of Mathematical Sciences at The University of Texas at El Paso. Her research interests include mathematical finance, applied mathematics, geophysics, nonlinear and stochastic partial differential equations and numerical methods. Dr. Mariani is the coeditor of Handbook of Modeling High-Frequency Data in Finance, also published by Wiley.
H. Eugene Stanley, PhD, is William Fairfield Warren Distinguished Professor at Boston University. Stanley is one of the key founders of the new interdisciplinary field of econophysics, and has an ISI Hirsch index H=128 based on more than 1200 papers. In 2004 he was elected to the National Academy of Sciences.
Frederi G. Viens, PhD, is Professor of Statistics and Mathematics and Director of the Computational Finance Program at Purdue University. He holds more than two dozen local, regional, and national awards and he travels extensively on a world-wide basis to deliver lectures on his research interests, which range from quantitative finance to climate science and agricultural economics. A Fellow of the Institute of Mathematics Statistics, Dr. Viens is the coeditor of Handbook of Modeling High-Frequency Data in Finance, also published by Wiley.
Introducing new and established mathematical foundations necessary to analyze realistic market models and scenarios, the handbook begins with a presentation of the dynamics and complexity of futures and derivatives markets as well as a portfolio optimization problem using quantum computers. Subsequently, the handbook addresses estimating complex model parameters using high-frequency data. Finally, the handbook focuses on the links between models used in financial markets and models used in other research areas such as geophysics, fossil records, and earthquake studies. The Handbook of High-Frequency Trading and Modeling in Finance also features:
* Contributions by well-known experts within the academic, industrial, and regulatory fields
* A well-structured outline on the various data analysis methodologies used to identify new trading opportunities
* Newly emerging quantitative tools that address growing concerns relating to high-frequency data such as stochastic volatility and volatility tracking; stochastic jump processes for limit-order books and broader market indicators; and options markets
* Practical applications using real-world data to help readers better understand the presented material
The Handbook of High-Frequency Trading and Modeling in Finance is an excellent reference for professionals in the fields of business, applied statistics, econometrics, and financial engineering. The handbook is also a good supplement for graduate and MBA-level courses on quantitative finance, volatility, and financial econometrics.
Ionut Florescu, PhD, is Research Associate Professor in Financial Engineering and Director of the Hanlon Financial Systems Laboratory at Stevens Institute of Technology. His research interests include stochastic volatility, stochastic partial differential equations, Monte Carlo Methods, and numerical methods for stochastic processes. Dr. Florescu is the author of Probability and Stochastic Processes, the coauthor of Handbook of Probability, and the coeditor of Handbook of Modeling High-Frequency Data in Finance, all published by Wiley.
Maria C. Mariani, PhD, is Shigeko K. Chan Distinguished Professor in Mathematical Sciences and Chair of the Department of Mathematical Sciences at The University of Texas at El Paso. Her research interests include mathematical finance, applied mathematics, geophysics, nonlinear and stochastic partial differential equations and numerical methods. Dr. Mariani is the coeditor of Handbook of Modeling High-Frequency Data in Finance, also published by Wiley.
H. Eugene Stanley, PhD, is William Fairfield Warren Distinguished Professor at Boston University. Stanley is one of the key founders of the new interdisciplinary field of econophysics, and has an ISI Hirsch index H=128 based on more than 1200 papers. In 2004 he was elected to the National Academy of Sciences.
Frederi G. Viens, PhD, is Professor of Statistics and Mathematics and Director of the Computational Finance Program at Purdue University. He holds more than two dozen local, regional, and national awards and he travels extensively on a world-wide basis to deliver lectures on his research interests, which range from quantitative finance to climate science and agricultural economics. A Fellow of the Institute of Mathematics Statistics, Dr. Viens is the coeditor of Handbook of Modeling High-Frequency Data in Finance, also published by Wiley.
Noch keine Bewertungen vorhanden
Verfassen Sie die erste Bewertung zu diesem Artikel
Helfen Sie anderen Kundinnen und Kunden durch Ihre Meinung.
Kurze Frage zu unserer Seite
Vielen Dank für Ihr Feedback
Wir nutzen Ihr Feedback, um unsere Produktseiten zu verbessern. Bitte haben Sie Verständnis, dass wir Ihnen keine Rückmeldung geben können. Falls Sie Kontakt mit uns aufnehmen möchten, können Sie sich aber gerne an unseren Kund*innenservice wenden.
zum Kundenservice